My initial Goal was to generate visuals over openid connect(oauth) or saml flows.
Ultimately, generate a Sequence Diagram of a realtime oauth,saml flow including browser and backend server to server communication. While being able to inspect contents of http request-response bodies.
Been there, want to share how i got there.
While tracing aspect is one major step, Furthermore, I digged out OpenAM with other two components of observabilty as logs and metrics via opensource options.
Finally consolidating them under one UI.
Challenge 1
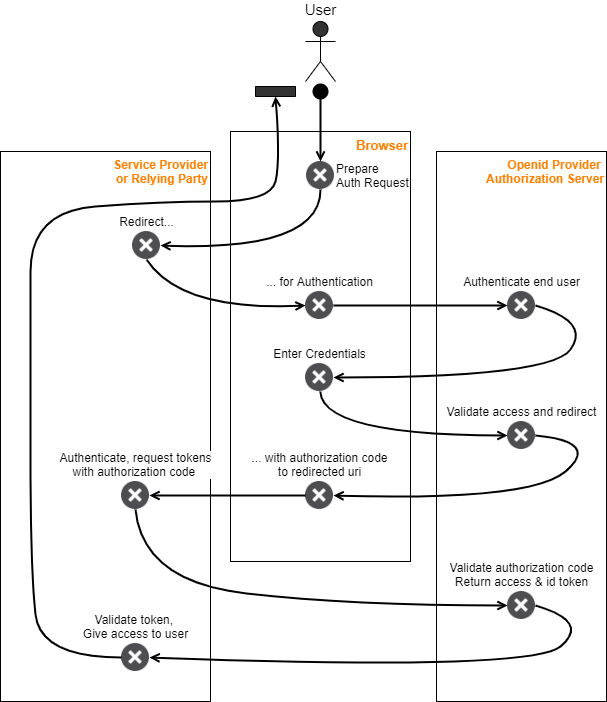
In a typical oidc grant flow, a considerable amount of traffic flows over the user’s browser via redirects. There is also backend traffic between Relying Party, Authorization server, etc. Similar messaging traffic happens on a SAML federation scenario. In general, you will find developer using SAML tracer extension or open developer tools of a browser during such development while trying to follow logs for what happens on the backend.
Since the traffic happens on different nodes, it is indeed a challenge to extract a simple flow documented with PlantUML below.
Moreover, when you track the real traffic, you have to filter other noises like static files(js,img), other redirects, irrelevant logs….

Image: Forgerock Authorization Code grant flow
I might be old fashioned, would prefer a usecasemap representation. Same oidc flow in UCM form…
Challenge 2
We loved wireshark once. Still, capture from a non-https backend communication rendered on wireshark is more than a thousand words.
Proxies are promoted to be an option by providing embedded or attached tracing integrations. Having the same drawbacks as sniffing, in addition, due to several reasons such as security considerations, applications tend to prefer browser as a direct correspondent.
A brave new world, once the package is out from the browser, you need to decrypt that ssl traffic while merging the captures from different nodes.
You need to be insider! Both on browser and jvm not to deal with extra ‘level bosses’.
Little less conversation, little more implementation
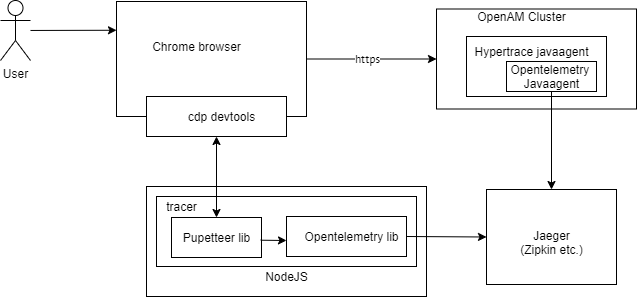
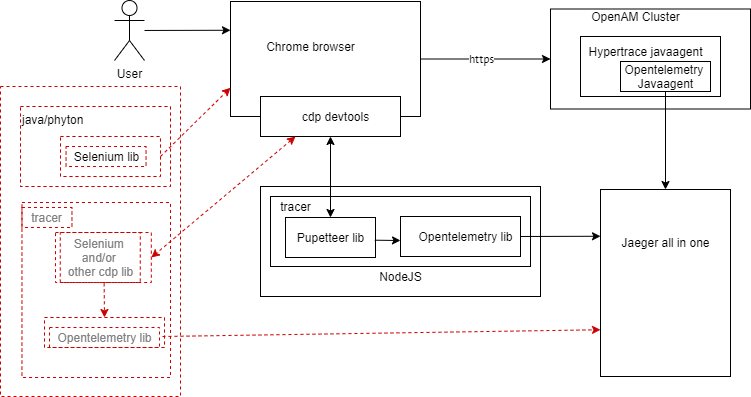
There are three main components attached to main actors to accomplish a full-scale tracing:
- Collecting traces
- Tracing the browser
- Tracing the backend
1. Collecting traces
To move forward, you would need a collector installed first. I tried Zipkin in the first iteration. As well checked the opentelemetry collector in between to have some further manipulation. Finally had my peace with Jaeger.
- Install docker
Start docker
service docker startDocker run Jaeger All in One
Folllowing command is the one I use. I do not stand for if all ports are necessary. Follow the instructions for the version you would be using provided in link.
docker run -d --rm -it -v /opt/apm/jaeger-1.20.0-linux-amd64:/config -p6831:6831/udp -p6832:6832/udp -p5778:5778/tcp -p8888:8888/tcp -p55679:55679/tcp -p5775:5775/udp -p16686:16686/tcp -p16687:16687/tcp -p14270:14270/tcp -p14271:14271/tcp -p14268:14268/tcp -p14269:14269/tcp -p14250:14250/tcp -p9411:9411/tcp -p13133:13133 jaegertracing/opentelemetry-all-in-one --log-level=debug --query.max-clock-skew-adjustment=1s
–query.max-clock-skew-adjustment=1s provides better timing adjustment between openam server and the browser in my case
Now you have an opentelemetry collector and Jaeger UI. Check jaeger running over browser.
http://192.168.X.Y:16686/Keep in mind, this jaeger docker container runs memory storage for traces. When you shut down, you will lose the tracing data collected so far.
2. Tracing the browser
I would have prefered a Chrome extension to provide spans to a tracing backend. Even there are some good intentions of such, there is no available extension in the Chrome market at the moment. There is as well some APM commercial vendors advertising browser instrumentation. By definition ‘commercial’ stands for expensive in APM market and the capabilities roughly I scanned through appeared to be not the right direction to move forward.
Chrome DevTools Protocol is the underlying technology to grab http request, response and much more. Although, by its name is associates the link in our brains to Chrome browser, interestingly yet became a defacto standard for the purpose. Firefox, Microsoft Edge and some other browsers have already adapted the protocol for the same purpose. Another example is Selenium remote webdriver utilizing CDP.
- Download ChromeDriver - WebDriver for Chrome according to your Chrome Browser version.
- Extract the ChromeDriver zip file to your Chrome installation directory
When you further dig CDP usage for a package intercept and manipulation, you will quickly reach Puppeteer as the most popular library used widely. Puppeteer is a Node library.
One more prerequisite is to produce and report the traces. opentelemetry-js nodejs library provides this functionality as our backend is already an opentelemetry collector.
Install opentelemetry-js libraries
npm install @opentelemetry/core
...
As a high-level scenario: - Write a Node.js application to… - Capture necessary request, response
  browser = await puppeteer.launch({userDataDir: './data/', headless: false}); ...
  page.on('request', request => { ...
  page.on('requestfinished', async (request) => { const response = await request.response(); ...
Create , end spans during captures
const span = opentelemetry.trace.getTracer('Browser').startSpan('https://openam-sp/openam/');Manipulate request headers. Append B3 headers for propagation. This is necessary Jaeger to correlate backend traces.
const headers = Object.assign({}, request.headers(), {
          'X-B3-TraceId': span.context().traceId,
          'X-B3-SpanId': span.context().spanId,
          'X-B3-Sampled': '1'
      });
Filter the requests. To instruct backend not to trace:
const headers = Object.assign({}, request.headers(), {
          'X-B3-Sampled': '0'
      });
When you run the application, opens (or remotely connects to) a Chrome browser
Test the authentication scenario on the browser
Observe the capture on Jaeger UI
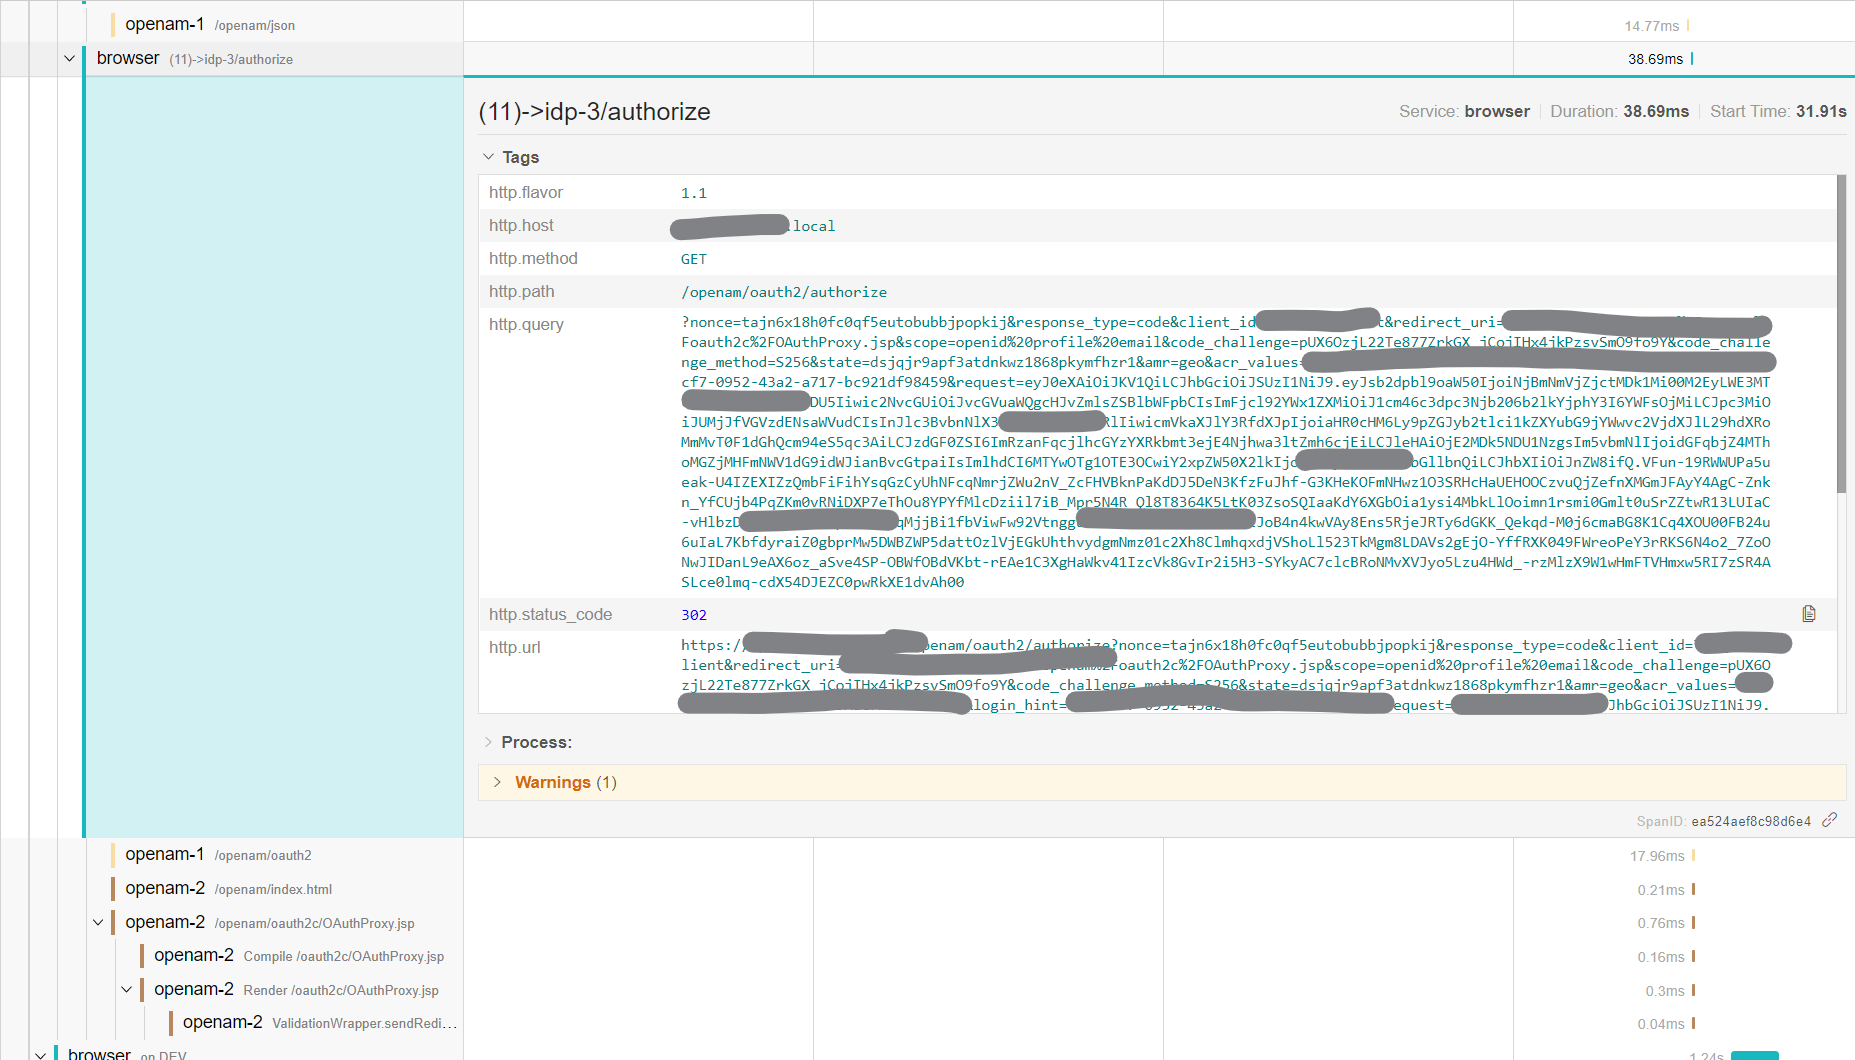
Additionally, append POST body, response bodies to span attributes. This will give oauth or saml overlay protocol visibility.
span.setAttribute('http.response.body', getResponseBody(response));
3. Tracing the backend
Luckily, implementation at the backend is not too tricky as tracing the browser.
I use inspectIT Ocelot in my initial trials. I sincerely value what they are doing. I have to comment, inspectIT Ocelot was the most complex instrumentation customization and configuration files I have seen among other APM’s of my experience. I observed OpenAM is making both traditional http calls and async http when it comes to server to server communication. On the junction when I realized inspectIT Ocelot was not yet supporting http Apache async calls, I turned my direction towards opentelemetry-java-instrumentation.
opentelemetry-java-instrumentation is a new player in town. Nonetheless, it is one of the hottest sub-branch on opentelemetry scope. Evolving every day. Even by this time I am writing this blog, opentelemetry-java-instrumentation library I used has progressed. Bottom line, it supports async http calls which I needed the most. One other side of the coin, instrumentation provided out-of-box is pretty much micro service-oriented. Custom instrumentation, unlike what generally provided by other java agents, is not yet configurable. I believe further configuration options is on the way. The trade-off with respect inspectIT Ocelot, further drill-down instrumentation on OpenAM underhood would not be possible in near future.
Even opentelemetry-java-instrumentation supported http async calls, it was not capturing request and response bodies. Http bodies are where pretty much most of the oidc and saml protocol stuff happens. For capturing request and response bodies/headers, I user Hypertrace OpenTelemetry Java agent which is a distribution of opentelemetry java agent providing the missing piece in the puzzle.
- Download hypertrace-agent-all.jar
Place the hypertrace-agent-all.jar under a folder on OpenAM machine(s) where tomcat user has access rights
chmod -R ugo+rwx /opt/apmAdd javaagent to JVM arguments of OpenAM Tomcat instance(s)
vi /etc/tomcat/tomcat.conf
-javaagent:/opt/apm/hypertrace-agent-all.jar -Dht.config.file=/opt/apm/config.yml -Dht.reporting.opa.endpoint=http://nowhere:666 -Dotel.exporter=jaeger -Dotel.exporter.jaeger.service.name=openam-1 -Dotel.propagators=b3 -Dotel.exporter.jaeger.endpoint=192.168.X.Y:14250
service tomcat start
Enjoy!
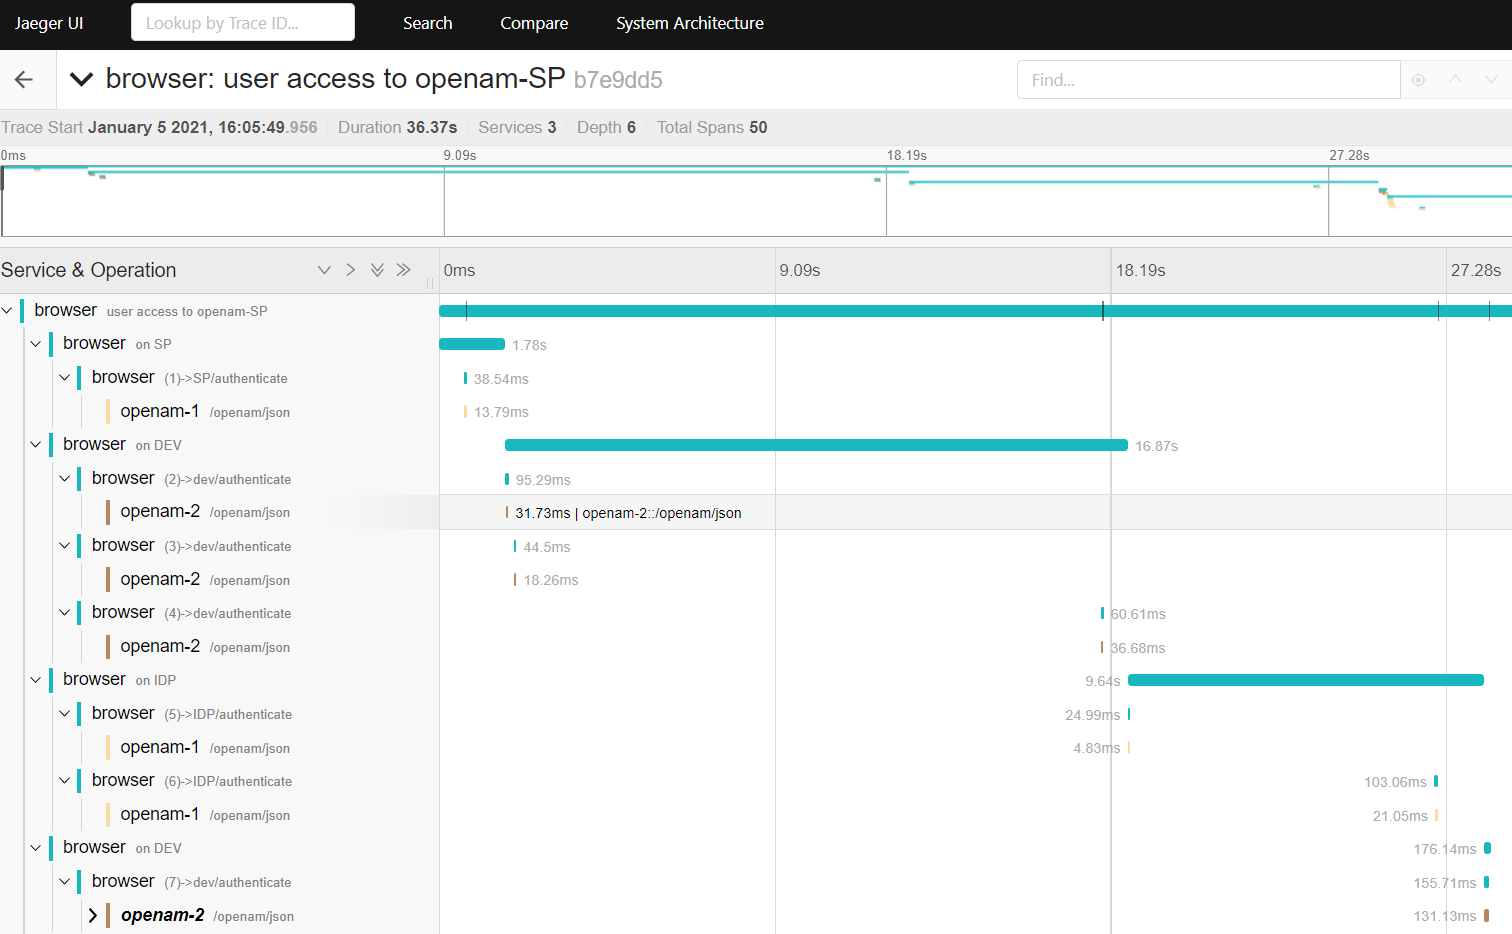
With the setup above, you will be able to capture not just an Authorization Code grant flow, also more complex scenarios such as sign-in to a oidc relying party, get forwarded to a federation hub and get your authentication from a saml IDP…
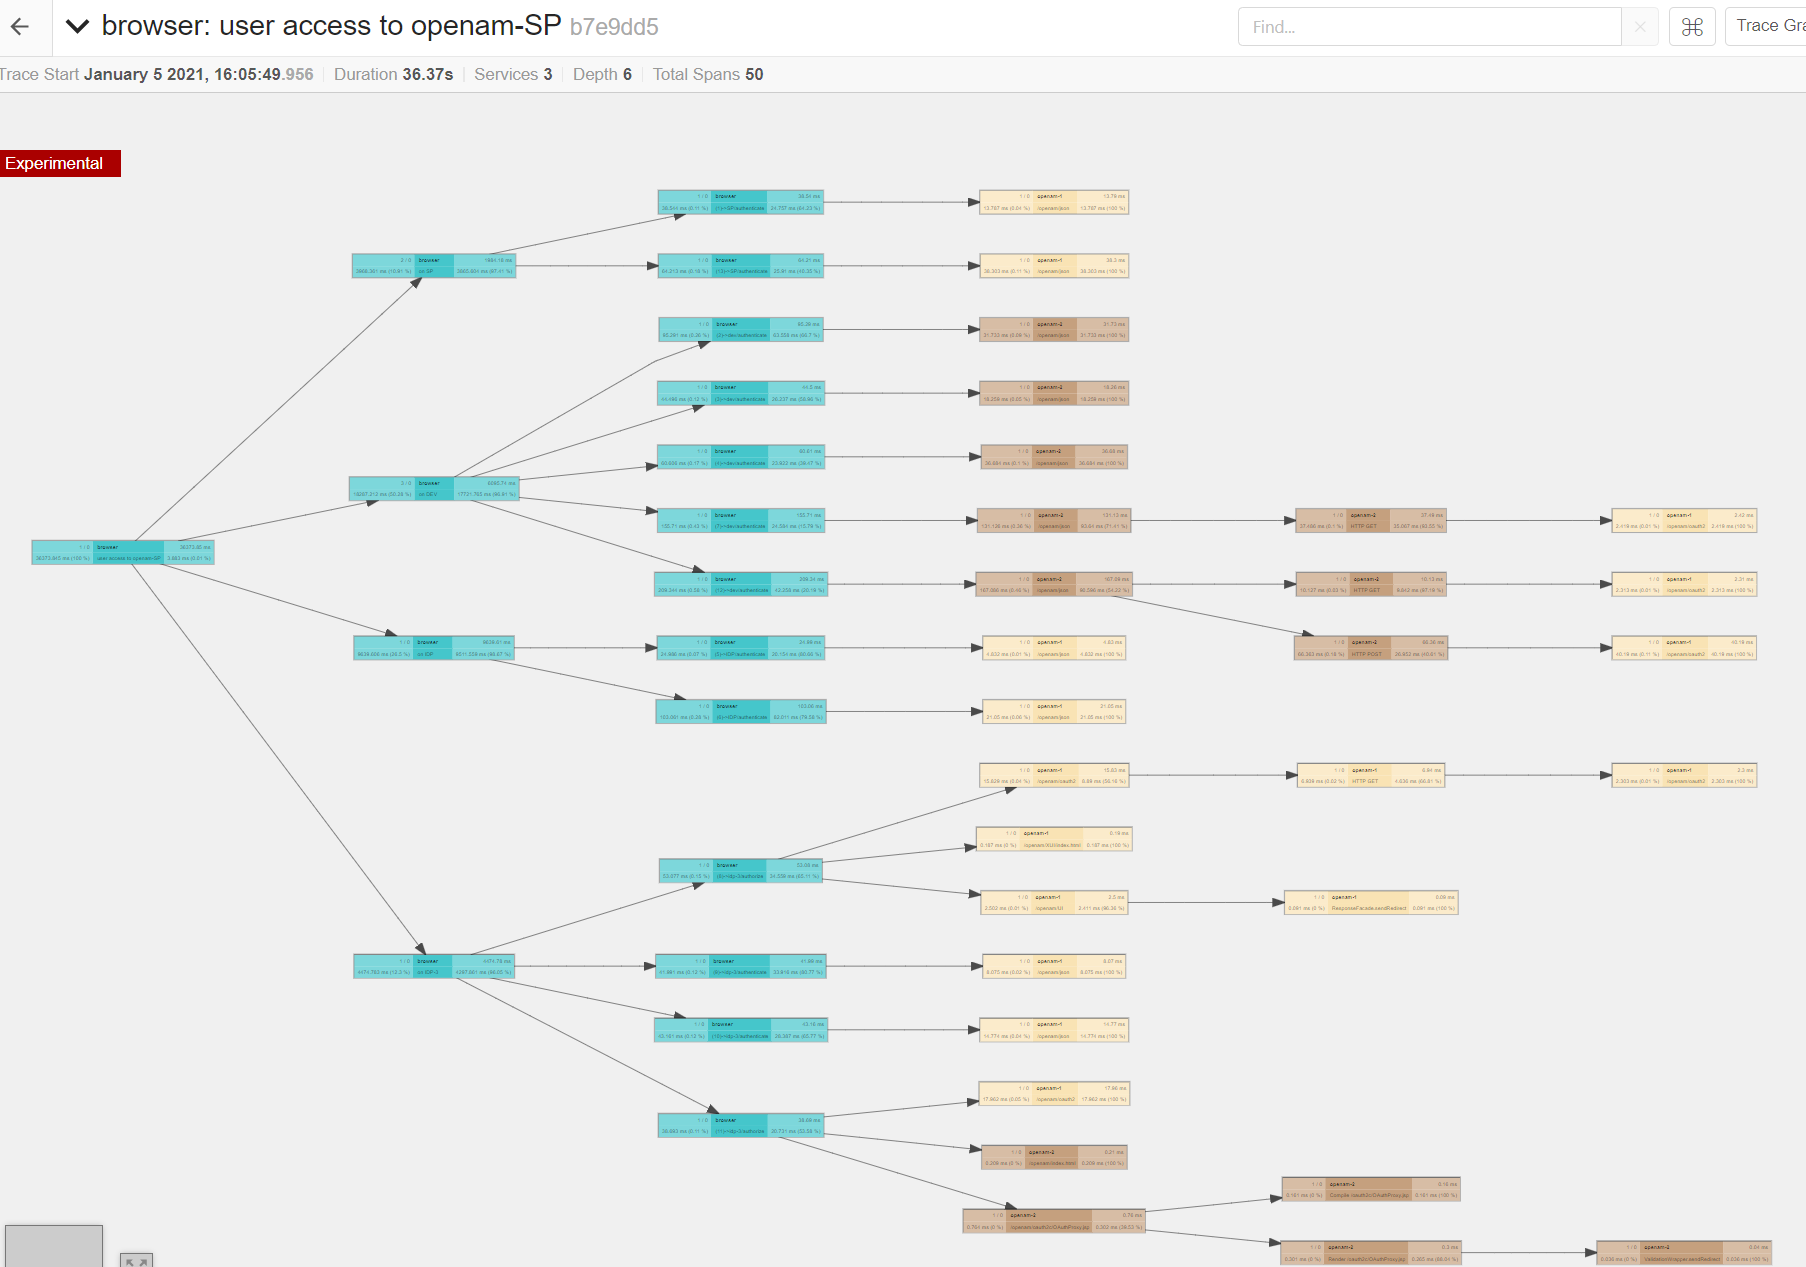
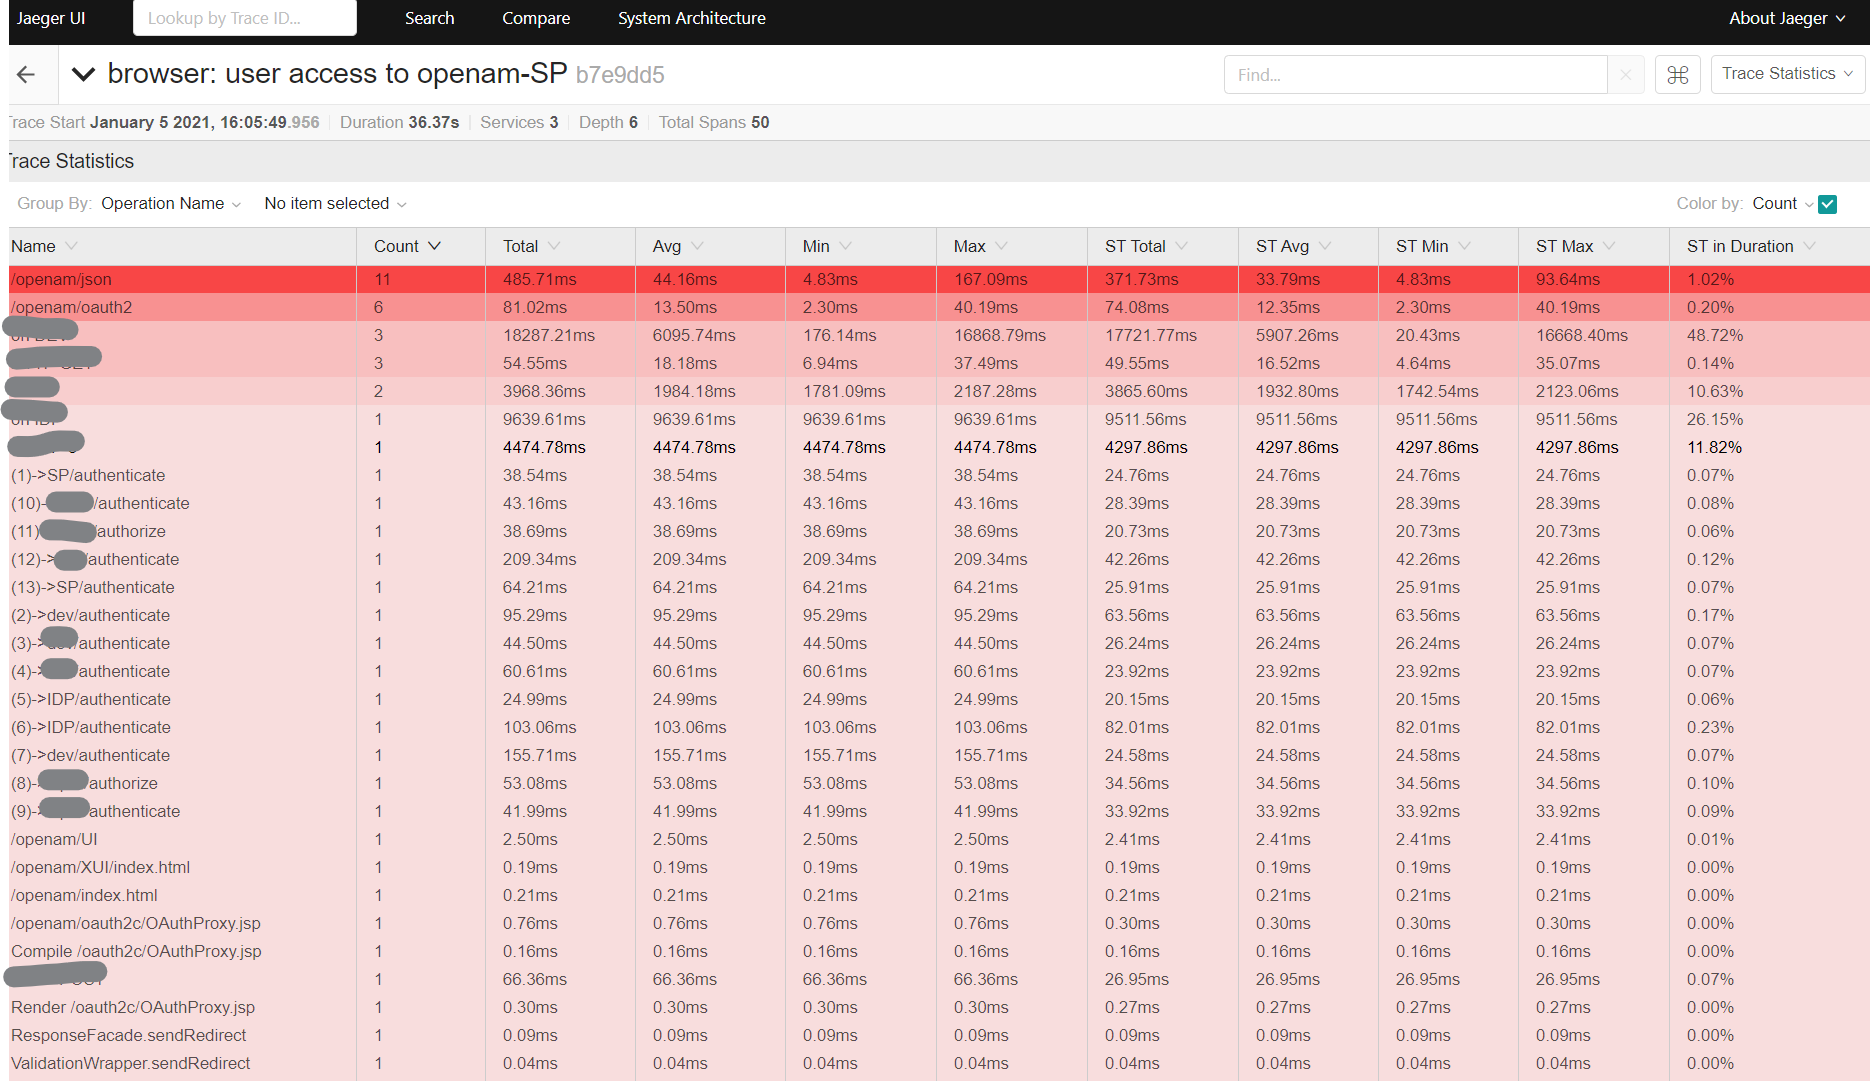
Here are some visuals regarding what you can get over Jaeger UI:
Sampled Trace With Backend and Body
Graph Visuals by Jaeger UI
Statistics by Jaeger UI
Automated Testing Usage
With the very same approach, you can adapt your Selenium Automated testing.
All you would need is a listener in java code and intercept the traffic to produce spans.
chromeDevTools = driver.getDevTools();
        chromeDevTools.createSession();

        chromeDevTools.send(Network.enable(Optional.empty(), Optional.empty(), Optional.empty()));
        chromeDevTools.addListener(Network.requestWillBeSent(),
                entry -> {
                   // create spans ...
                });
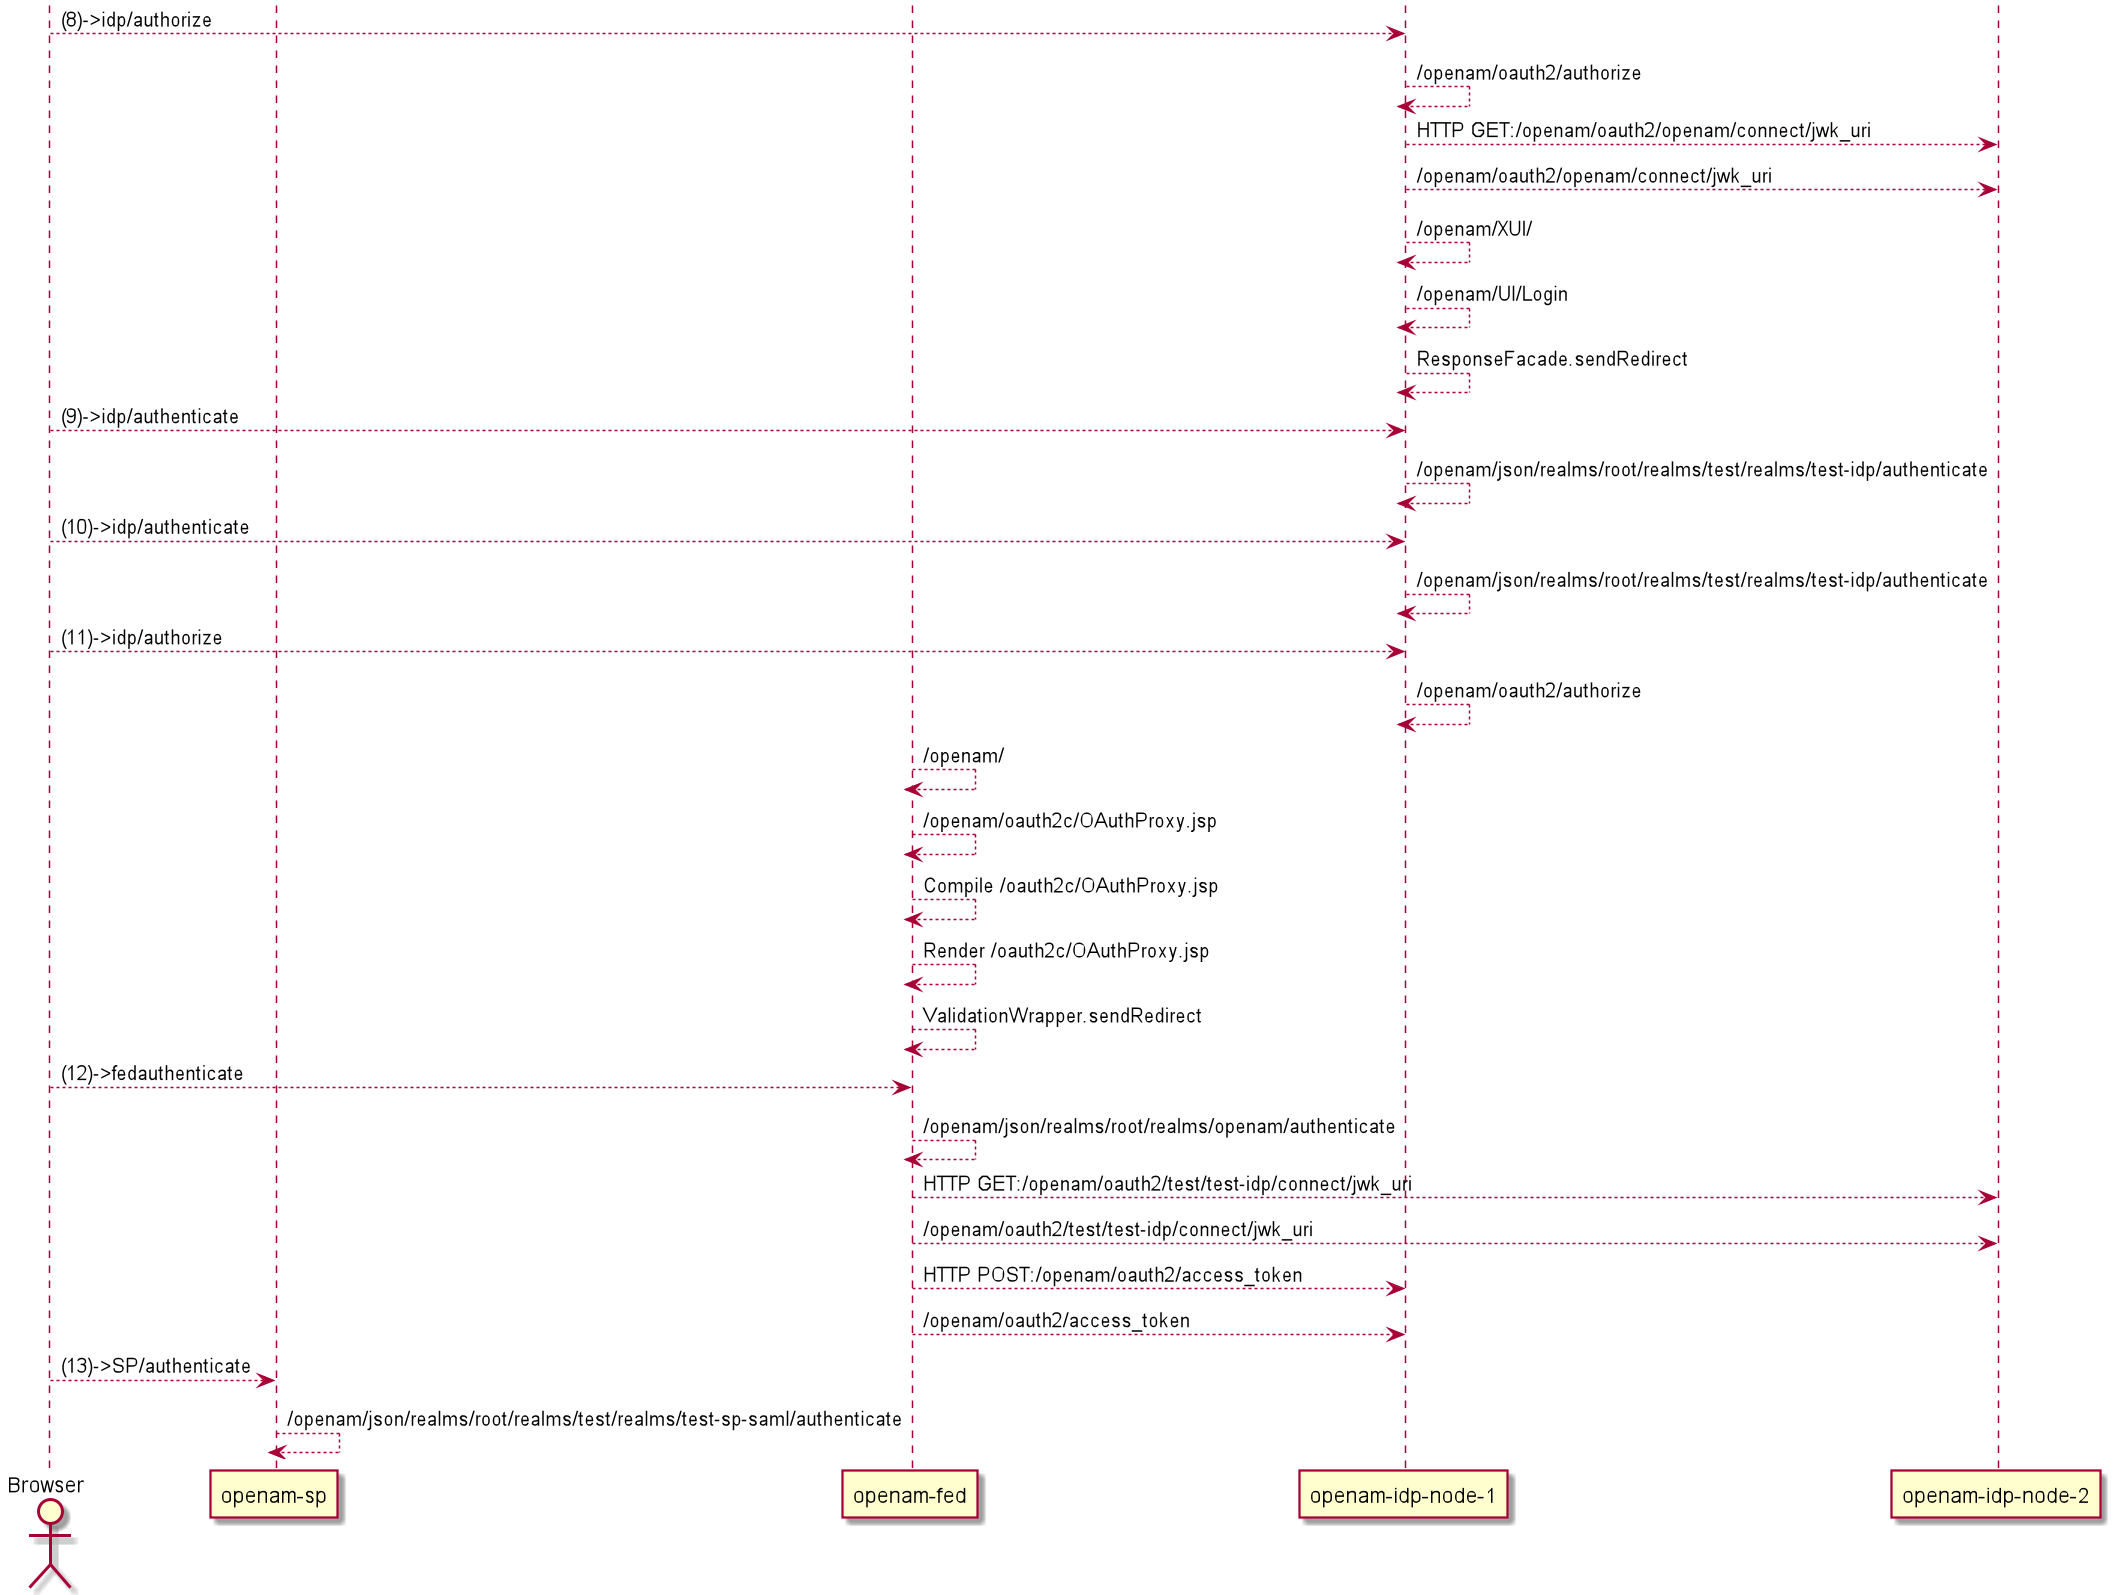
Generating the Sequence Diagram
Jaeger provides json endpoint for traces.
http://192.168.X.Y:16686/api/traces/708ab1b9e48fb11fa25b066c6e988450
With the help of plantuml sequence-diagram, you can convert json trace files. I saw some trying to develop such a tool on the internet. Nevertheless, it is just parsing the json and outputting the following format:
@startuml
autoactivate on
actor Browser
"Browser" --> "openam-sp": ()->SP/authenticate
"openam-sp" --> "openam-sp": /openam/json/realms/test-sp-saml/authenticate
...
@enduml
But… Is this observability?
Yet we created the tracing aspect of the observability trilogy. Unfortunately, opensource world, you do not have 5 pillars of APM conceptual framework all in place at once.
The opensource equivalent is 3 pillars as metrics, logging andt tracing. Having a UI to access all is quite key functionality. That is where commercial APM’s still better than any opensource alternative. It is fair to say, the opensource portfolio is evolving. Best option so far is Grafana
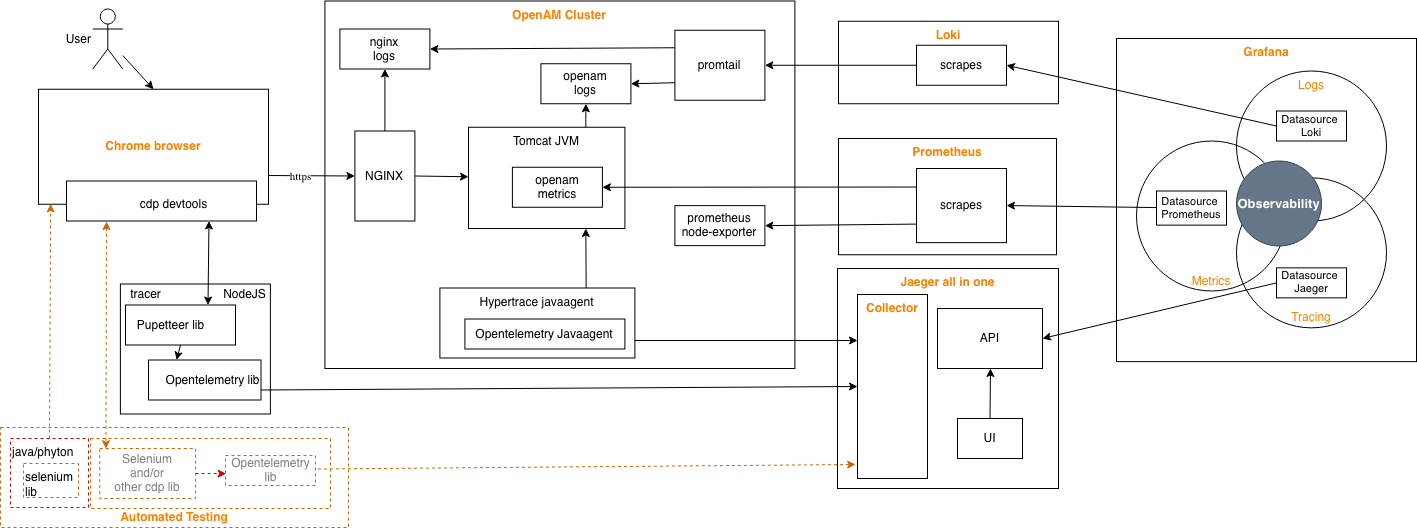
To get three pillars of observebality on Grafana together for OpenAM:
- Tracing - Integrate Jaeger to Grafana
- Logs - Configure Loki , integrate to Grafana
- Metrics - Configure Prometheus , integrate to Grafana
1. Tracing - Integrate Jaeger to Grafana
- Install Grafana 7
- Add your Jaeger as datasource

- From the explore menu item of Grafana, now you should be able to access your Traces as in Jager UI
2. Logs - Configure Loki , integrate to Grafana
- Install loki
- Install promtail binary on OpenAM instance
- Configure to collect OpenAM debug.out and if you use NGINX logs with promtail
- Add loki as datasource to Grafana
3. Metrics - Configure Prometheus , integrate to Grafana
- Install Prometheus
- Install Prometheus node-exporter for OS metrics such as cpu, memory etc.
- Configure OpenAM prometheus metrics
- Add scrape configs to Prometheus
- Add Prometheus as datasource to Grafana
- Add OpenAM dashboard to Grafana
Unfit
- For trace metrics that are available on Jaeger Statistics page is not available as metrics to Prometheus and so to Grafana. Neither, OpenTelemetry Java agent can provide trace metrics at the moment, nor Opentelemetry collector provides a processing option to form metrics like Opentracing once did.
Tracing metrics are very important. It looks it is planned. We need to be patient. For now, I am grabbing response times on the server side via NGINX Loki integration. Not very fancy.
Jaeger provides a kind of runtime architecture. But it is nothing like we are used to in APM products. The main reason behind this is not the Jaeger itself or any other UI(Zipkin) in the first place. Since opentelemetry and its predecessors mainly designed for microservices, they kind of interpret the “service name” differently. No way you can change it logically. It is per agent. In other terms, you can not have two different services under one JVM,CLR etc. This looks like going to be long run.
PromQL is tricky to construct. Miss commercial APM charts where metrics are just a click away.
Beyond
Terminologies to define similar set of concepts change over time. Observability is the new fashion. Observability does not stand for APM one hundred percent.
What we get from Zipkin or Jaeger so far was basically “Deep dive component” of traditional APM’s. On the other hand, traditional standalone APM’s themselves was not very involved with Log Analytics. Payed attention to metrics as little as needed. APM’s were generally not marketed standalone, were either a part of monitoring suite or coupled with other suites.
So it is not that straightforward to map APM to Observability. Logging is kind of newbie in monitoring town. We even see in reverse, a Log Analytics company Splunk purchase SignalFx APM and merges into their portfolio.
What defined as three pillars under Observability is indeed a good roadmap!
Tracing component is the main intersection with APM Conceptual Framework. Following table might give an idea to map the components experimented here within OpenAM Forgerock in terms of where they sit on APM perspective. Also, mentioned promises on opensource roadmap in near feature into mapping.
| APM Conceptual Framework | Observability Components |
|---|---|
End user experience |
opentelemetry-js via browser tracing, Selenium as EUM |
Runtime application architecture |
Partially available on Jaeger as Deep Dependency graph, * Grafana Node graph panel |
Business transaction |
Opentelemetry browser and backend traces, * Grafana Node graph panel |
Deep dive component |
Jaeger trace waterfall, **Prometheus Exemplars both served together via Grafana |
Analytics/reporting |
Prometheus metrics via Grafana charts. Tracing metrics still a huge gap. |
*Finally, a light appeared on the end of tunnel for Run Time Architecture presentation on Grafana. Node graph panel visualization - Beta available with 7.4 release. No clue how it will work with Jaeger for now. Aws xray did it, so it should be doeable. 🙂✌️
**Exemplars seems promising. Looking forward to getting my hands on it.
Points to ponder
How Forgerock transaction ID can fit into this picture?
Chrome extension for opentelemetry would be great! Zipkin once did zipkin-browser-extension. Something similar to user experience of Google Web Tracing Framework to start a trace during web navigation but creating traces,spans and exporting to an opentelemetry collector instead. This is the missing enabler for developers into ops world. A precise answer to “Why?” starts here 👉🏽 Forget DevOps, let’s do OpsDev