Mapping APM towards Observability
In previous post, I tried my best to translate Gartner’s APM Conceptual Framework to three pillars under Observability by mapping components. I will not go into details this time. However, there is remarkable progress on topic. I tried to reflect up to date situation as follows. My main focus along this article will be End user experience item and a working solution with selenium and tracing that can be used for End User Monitoring (EUM).
As a summary:
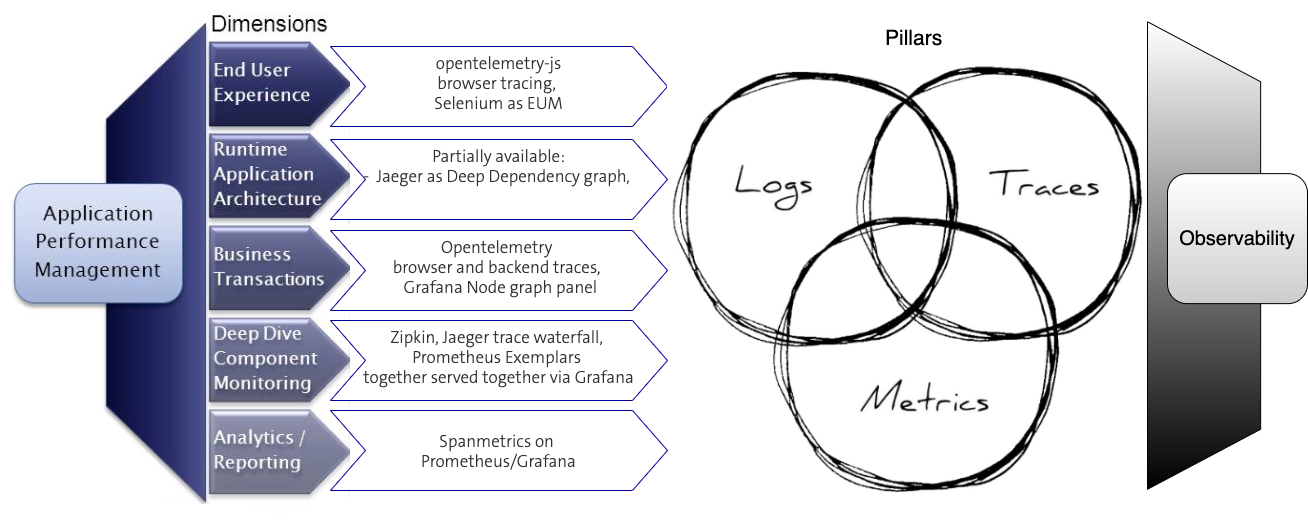
| APM Conceptual Framework | Observability Components |
|---|---|
End user experience |
opentelemetry-js via browser tracing, Selenium as EUM |
Runtime application architecture |
Partially available on Jaeger as Deep Dependency graph, * Grafana Node graph panel |
Business transaction |
Opentelemetry browser and backend traces, * Grafana Node graph panel |
Deep dive component |
Jaeger trace waterfall, **Prometheus Exemplars both served together via Grafana |
Analytics/reporting |
Spanmetrics on Prometheus/Grafana. |
End User Experience (EUE)
As per wikipedia definition “End User Experience (EUE)”
Measuring the transit of traffic from user request to data and back again is part of capturing the end-user-experience (EUE).
Traditionally , End User Experience was addressed with two main lanes as Passive Monitoring ( Real User Monitoring / RUM ) and Active Monitoring (End User Monitoring / EUM ).
Real User Monitoring (RUM) is yet another aspect. Where it traditionally involves sniffing traffic. I am leaving RUM aside and move the attention towards active monitoring EUM…
End User Monitoring (EUM)
End User Monitoring, consists of synthetic probes and web robots predefined to report system availability and business transactions.
Traditionally this functionality is accomplished by vendor provided cloud services or robots. One popular example is with HP BPM - VuGEN scripted agents running a scenario as login, query customer, logout over browser UI.
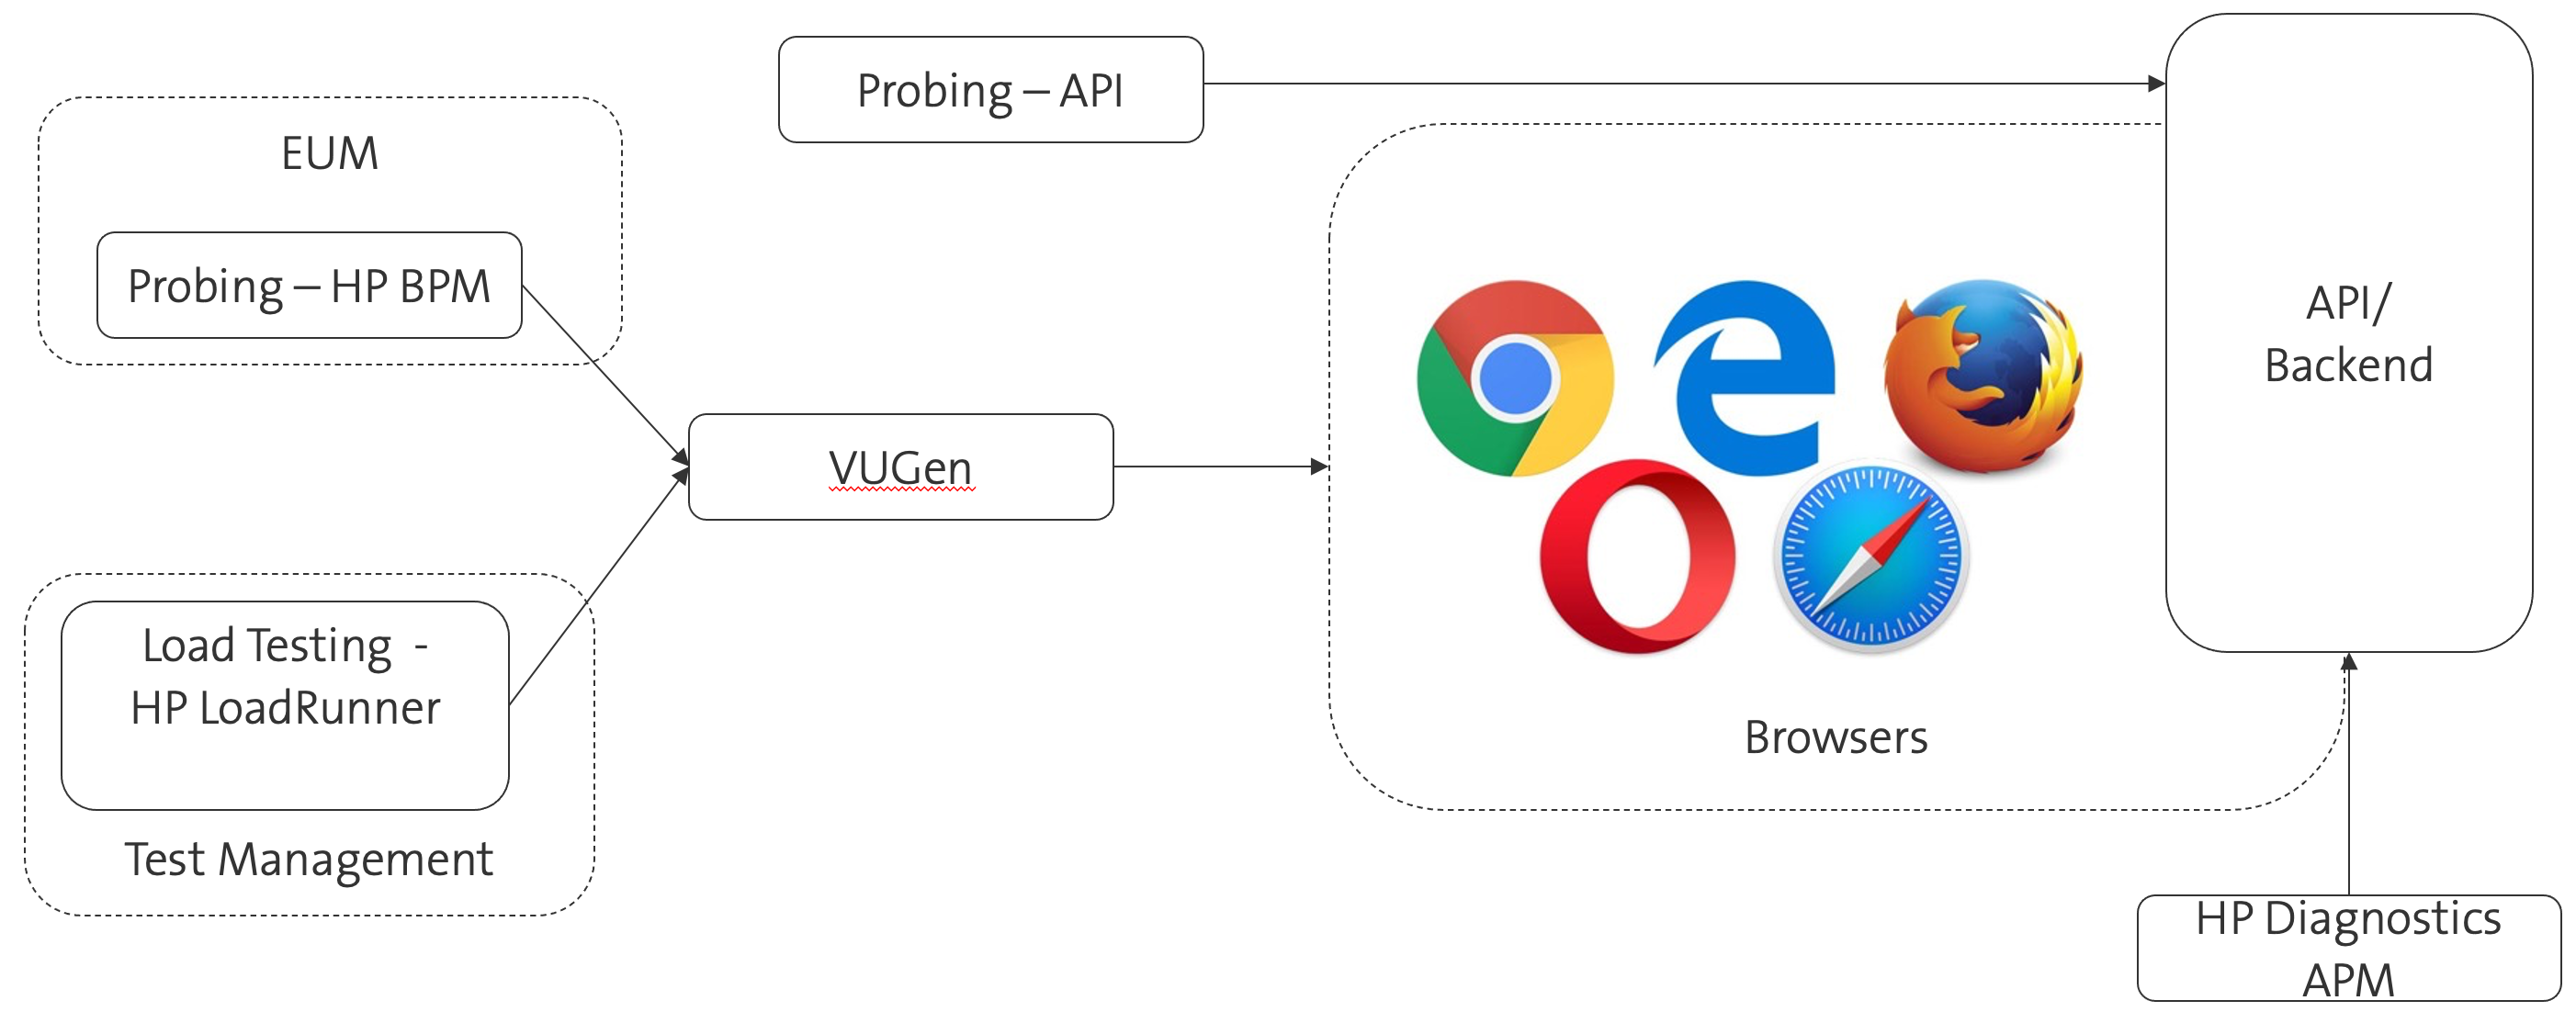
Backend, typically same vendor’s APM and Monitoring suite was used at backend which provides advanced analysis capabilities.
Main difference along the cloud transformation journey we are all in is vendor based solutions tend to transform into opensource recipe’s. Even the observability tools are pre-mature, promising a wider picture for future than its successor era.
Ingredients
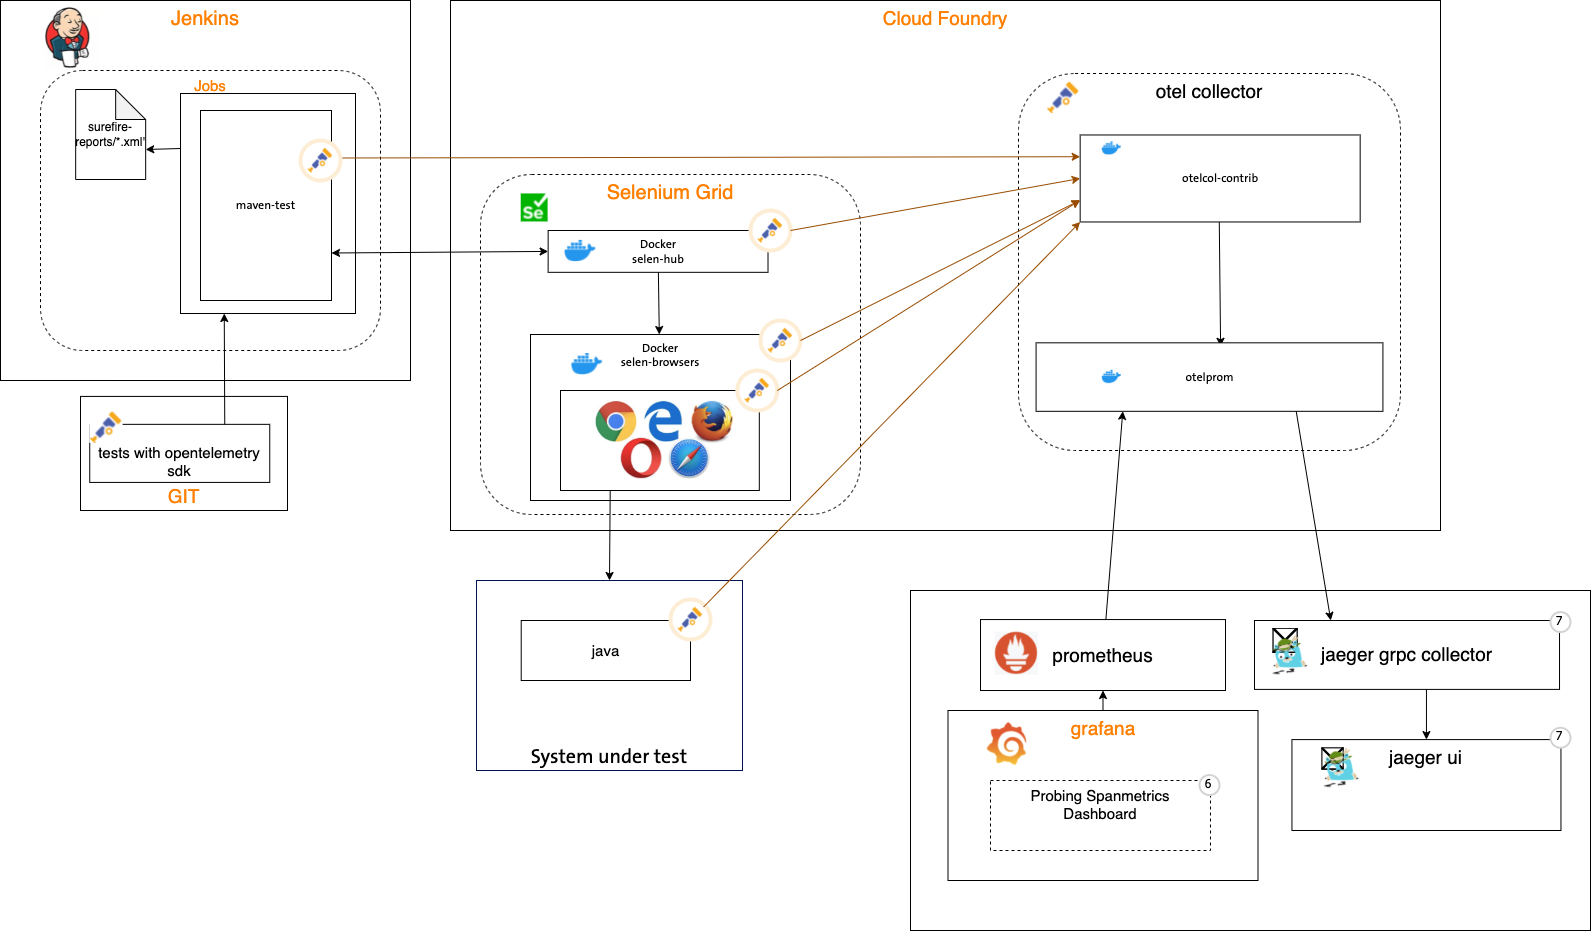
Recipe i and ii
- Opentelemetry SDK and auto-instrumentation
- Collector
- Otel Collector with spanprocessor for generating spanmetcics
- Grafana Agent
- Metrics - Configure Prometheus , integrate to Grafana
- Grafana for Metrics
- Tracing UI
- Jaeger for tracing UI
- Grafana for tracing UI
- Logs - Configure Loki , integrate to Grafana // optional
- Architecture is considering a prometheus with no remote push capability. It is possible to get rid of one of the collectors in newer versions.
Missing
- Unfortunately, by the time I use such setup, still the cdp devtools tracing inside selenium docker browsers were not functioning. It functions without containerization on a local testing scenario. I do believe it is a known issue by selenium.